SPX 0DTE Gamma Exposure: A Guide to Same-Day Positioning
SPX 0DTE gamma exposure shows modeled positioning for options expiring that day, while broader views include additional expirations. Learn how to compare scopes, track changes, and use heatmap levels as context—not forecasts.

A strike can dominate an SPX 0DTE gamma exposure heatmap yet look less important when you include other expirations. If you overlook that difference, you can mistake one expiration’s concentration for the market’s entire positioning profile. Comparing like-for-like snapshots helps you identify what is specific to today’s expiry—and when the map offers no useful support for a trade.
A 0DTE option expires that trading day. A same-day heatmap isolates modeled exposure for that expiration; a broader view includes additional expirations. Neither automatically deserves priority.
The key word is modeled. A gamma exposure display is not a direct record of dealer inventory, and heavy options volume does not establish net positioning. This guide uses a hypothetical morning-to-afternoon comparison table to show how the context can change without producing a price forecast.
Key takeaways
- Same-day and broader-expiration views answer different questions. Identify the contracts included before comparing levels.
- Gamma tends to be higher near the money and close to expiration, but high gamma does not guarantee a price reaction.
- Trading volume, modeled gamma exposure, and actual dealer inventory are different measures.
- Compare matching timestamps first, then examine how each expiration’s profile changes through the session.
- Options and 0DTE trading carry substantial risk of loss. Heatmap levels are context, not trade instructions.
What does SPX 0DTE gamma exposure describe?
SPX 0DTE gamma exposure estimates aggregate gamma associated with SPX options expiring that day, often displayed by strike. It describes a modeled sensitivity profile—not a direct readout of every dealer’s holdings, a confirmed hedging requirement, or a forecast of the index’s next move.
Start with three terms:
| Term | Plain-English meaning | What it helps you understand |
|---|---|---|
| Delta | An estimate of how an option’s value responds to a move in the underlying | The option’s current directional sensitivity |
| Gamma | The expected change in delta for a $1 underlying move | How quickly that sensitivity may change |
| Gamma exposure, or GEX | An estimate of aggregate gamma exposure for a defined set of options | Where modeled exposure is concentrated |
The Options Industry Council’s explanation of gamma defines gamma through the expected change in delta for a $1 move in the underlying. Its separate guide to options Greeks cautions that Greek estimates do not guarantee exact option-premium changes.
GEX takes the discussion from an individual option to a collection of contracts. The displayed values depend on the model, its assumptions, and the options included.
That last point drives the workflow: before reading a node, identify which contracts the view includes. A node is a displayed concentration at a particular strike and expiration. For the underlying mechanics, start with our plain-English guide to GEX in options.
Why does the expiration scope change the question?
A same-day view isolates the modeled profile for today’s expiration, while a broader view includes additional expirations. Comparing them helps you distinguish a concentration specific to today’s expiry from one visible across a larger set of contracts, without assuming either profile controls price.
Expiration scope means the set of expirations included in a measurement. Treat it as part of the question, not a cosmetic display setting.
| Same-day view asks… | Broader view asks… |
|---|---|
| Where is modeled exposure concentrated in today’s expiration? | Where is exposure concentrated across the included expirations? |
| Which nearby strikes stand out within this expiry? | Do those strikes remain prominent when other expirations are included? |
| How has today’s profile changed? | How have the additional expirations or combined profile changed? |
| Is this concentration specific to today? | Is it also present outside today’s expiry? |
Different expirations can contribute different amounts of modeled exposure at the same strike. Where a model aggregates signed exposure, those contributions may reinforce or offset one another. A prominent same-day node can therefore look less prominent in a broader profile.
Neither result invalidates the other. You changed the population of contracts being measured.
Read “all expirations” carefully, too. It means the expirations included by that source and setting—not necessarily every relevant options position across every product. Looking at several expiration-specific boards also is not the same as calculating a combined exposure total.
Practical rule: “Large exposure at 6000” is incomplete until you know the symbol, expirations, timestamp, and measurement convention.
Why can gamma be higher near the money and near expiration?
Gamma tends to be higher for options near the money and closer to expiration, making same-day options especially sensitive around nearby strikes. That describes how delta can change; it does not establish that SPX will move toward a strike, reverse there, or accelerate through it.
The OIC’s gamma explanation states that gamma is higher for options that are at the money and closer to expiration. An option is at the money when its strike is near the underlying’s current level.
For a hypothetical example, suppose SPX is near 6000. The same-day 6000 options may have greater gamma sensitivity than otherwise comparable options far above or below the current index level.
But these are different statements:
- Sensitivity statement: delta may change quickly near this strike.
- Price forecast: the index will react in a particular direction at this strike.
The first does not establish the second.
Individual-option gamma also differs from aggregate exposure. A contract’s sensitivity alone does not tell you how much modeled exposure is concentrated there or whether that concentration outweighs other expirations.
Do not assume every node must grow into the afternoon, the nearest strike must become dominant, or a large concentration must attract price. Same-day options gamma deserves attention—not automatic priority over every other input.
Does 0DTE volume tell you how much dealer gamma there is?
No. Volume counts contracts traded, while modeled GEX estimates exposure under a defined methodology. Actual dealer inventory consists of positions held by dealers; neither a volume total nor a public heatmap independently reveals every dealer’s holdings or establishes the size and direction of net hedging activity.
Large activity numbers are easy to mistake for large net positions.
In its report published January 22, 2026, Cboe’s “The State of the Options Industry: 2025” reports that SPX 0DTE averaged 2.3 million contracts daily in 2025, representing 59% of SPX options volume. Those figures measure trading activity—not net dealer gamma.
| Measure | What it describes | What it does not establish |
|---|---|---|
| Options volume | Contracts traded during a period | Net positions remaining or dealer exposure |
| Modeled GEX | Estimated exposure for the model’s selected contracts | Confirmed holdings of individual dealers |
| Actual dealer inventory | Positions dealers hold | A complete public view available from volume alone |
Contracts can change hands repeatedly, and activity on different sides can offset. Gross trading activity and the positions remaining afterward are different quantities.
“Today’s expiration accounted for most of the volume” therefore does not establish that it accounted for most of the net gamma exposure.
The useful question is not simply, “How many contracts traded?” It is, “What does this measure actually tell me?”
How do you compare same-day and broader-expiration SPX GEX?
Confirm the symbol, session date, expiration scope, and observation time before comparing nearby strikes. Keep a same-time scope comparison separate from a same-expiration comparison over time. The goal is to identify differences in modeled exposure—not create a trade signal because one node looks large.
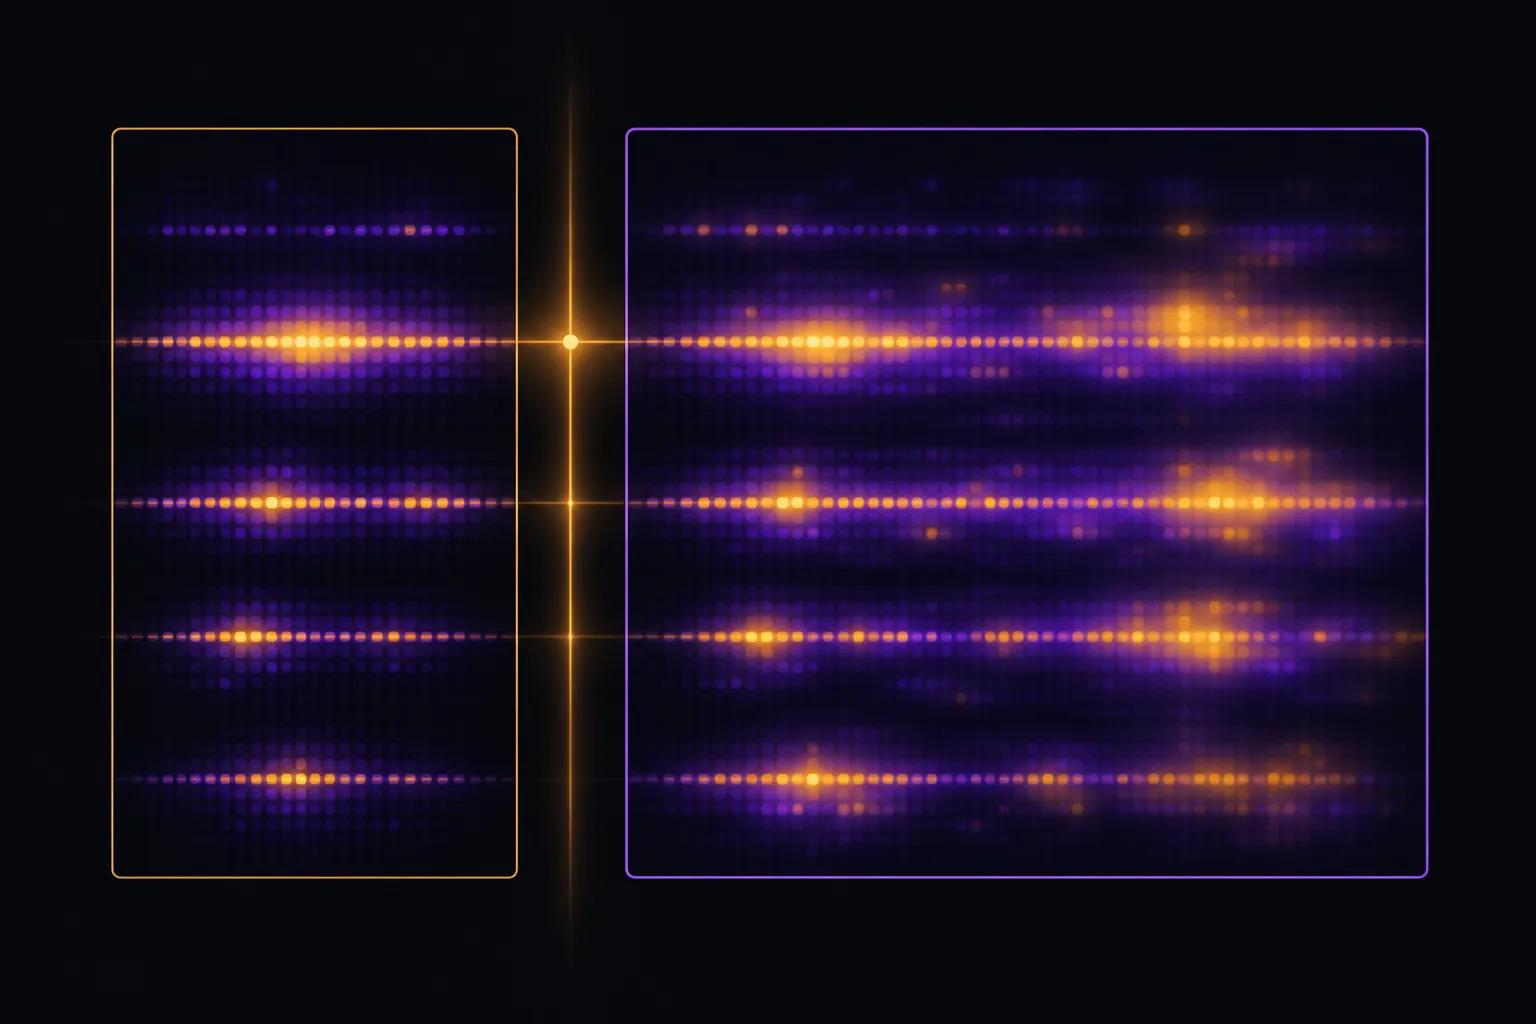 Illustrative comparison of same-day and broader modeled positioning; heatmap levels are context, not confirmed inventory or a forecast.
Use this six-step sequence:
Confirm the contract family and session.
Check the symbol, date, and settlement details. SPX and SPXW labels are not a reason to skip contract verification.Identify the expiration being inspected.
Confirm that the same-day view actually includes today’s expiration. Do not infer it from a screenshot caption or saved workspace name.Match the observation times.
Compare snapshots from the same time where possible. Otherwise, you may confuse a change through the session with a difference between expiration scopes.Inspect nearby strikes in today’s expiration.
Note prominent nodes, their distance from the underlying, and changes in displayed size. Include observations that challenge your initial interpretation.Inspect the same area in other expirations.
Record whether those strikes also contain prominent concentrations. If using a combined view from a source, verify which expirations it includes and how it expresses exposure.Check price structure and invalidation.
Look for rejection, sustained trading beyond the area, or continued movement through it. State what would make the level-based interpretation no longer useful.
Verify SPXW and settlement details
Cboe’s available Weeklys information identifies SPX Weeklys under the SPXW root and describes them as PM-settled, distinct from traditional AM-settled SPX options. Confirm the specific contract’s settlement terms rather than assuming every SPX option follows the same schedule.
For SPXW gamma exposure, the expiration date is only part of the identification. The contract family and settlement terms matter too. “Expires today” should describe the contract you verified, not an assumption based on the ticker.
Inspect the relevant expirations in TrueGEX
In TrueGEX, select and inspect the relevant SPXW expiration on the heatmap board, then examine other relevant expirations separately. Verify whether you are looking at SPXW weeklies or an AM monthly expiration before interpreting the nodes.
This uses the verified strike-and-expiration view; it does not require assuming a particular “all expirations” toggle or aggregation control. The TrueGEX heatmap guide provides the reference for reading the board.
The King is the single largest node on a board, highlighted and starred. Node velocity shows growth or fading across seven windows from one minute to one day; the Node panel shows a node’s size through the day and its share of the King.
Use these features to examine prominence and change, not to infer confirmed dealer inventory. Boards update about once a second during the trading session, so record the observation time when saving notes.
Keep scope and time separate
A scope comparison asks, “What differs between these expiration selections at the same time?” A session comparison asks, “What changed in the same expiration over time?”
Comparing a morning same-day board with an afternoon broader profile changes two variables at once. You cannot cleanly attribute the difference to expiration scope or the passage of time.
What can a hypothetical morning-to-afternoon comparison show?
A morning-to-afternoon comparison can show that a selected expiration’s profile has changed while concentrations in other expirations remain relevant. It can also expose an interpretation that has become stale. Neither snapshot establishes why price moved or what it must do next.
Everything below is hypothetical. The strikes, times, and observations are illustrative—not live levels or trade recommendations.
Assume each morning observation is recorded at the same time across the selected scopes, and the process is repeated in the afternoon.
| Observation | Hypothetical morning, 10:00 a.m. ET | Hypothetical afternoon, 2:00 p.m. ET |
|---|---|---|
| Underlying location | Near 6000 | Near 6010 |
| Same-day profile | Prominent modeled node at 6000 | The 6000 node is smaller; 6010 is more prominent |
| Other included expirations | Concentrations at 6000 and 6025 | The 6025 area remains prominent |
| Useful question | Is 6000 relevant to current chart structure? | Does the morning interpretation still fit current evidence? |
Morning: distinguish the scopes
At 10:00 a.m., the 6000 node stands out in the selected same-day expiration. Other expirations also contain a substantial concentration at 6025.
A careful reading is: “6000 is prominent within today’s expiration; 6025 adds context outside today’s expiry.”
An unsupported reading is: “The market must stay at 6000 before moving to 6025.” The observations have not established that sequence, a target, or a reason to enter a position.
The distinction matters even if price later visits both strikes. A subsequent move does not prove that the original forecast followed from the heatmap.
Afternoon: refresh the interpretation
At 2:00 p.m., the hypothetical same-day profile looks different. That does not mean 0DTE nodes always shift this way, or that the changing node caused the underlying’s movement.
Recheck the expiry, timestamp, node size, other expirations, and price response. Do not keep using a morning label as though the underlying and displayed exposure had stayed unchanged.
Preserve what was visible at each moment. Replacing the morning observations with the final afternoon profile creates hindsight: you are evaluating an earlier decision using information unavailable then.
Define what would invalidate the reading
Ask: “What would show that this level is no longer useful for this interpretation?”
If price moves through 6000 and establishes chart structure beyond it, a prior rejection-based interpretation may no longer fit. A larger node is not a reason to ignore that contradiction.
For any hypothetical trade built around the area, define the chart-based invalidation, stop or exit rule, and maximum acceptable loss before entry. A planned stop does not guarantee execution at that price. If the level breaks, the scenario fails; the map does not justify increasing risk.
What do gamma flip, call wall, and put wall labels mean?
These are provider-dependent labels, not standardized contract terms. As common conventions, “gamma flip” refers to a modeled net-gamma sign-change level, while “call wall” and “put wall” describe prominent call-side or put-side levels. Verify the provider’s definitions and expiration scope before interpreting them.
Treat these conventions as starting vocabulary, not universal definitions:
- Gamma flip: commonly an estimated underlying level where modeled net gamma changes sign.
- Call wall: commonly a prominent call-side level under the provider’s methodology.
- Put wall: commonly a prominent put-side level under the provider’s methodology.
The relevant questions are what the provider measures, how it assigns signs, and which expirations it includes. A same-day estimate and a broader-scope estimate need not match.
A positive or negative modeled exposure value is not a direct bullish or bearish instruction. Likewise, “wall” does not mean an unbreakable barrier.
When the definition is unclear, use a narrower description: “This strike is prominent in the displayed same-day profile.” That reports the observation without adding an unsupported forecast.
Can 0DTE options affect volatility?
Research examines whether 0DTE activity can affect volatility, but it does not establish a universal rule that 0DTE always raises or lowers it. Findings depend on the sample, measurement method, and question studied. A live heatmap does not turn those findings into a forecast for the current session.
The January 2025 paper “0DTE Index Options and Market Volatility: How Large Is Their Impact?” estimates aggregate market-maker positions and gamma from SPX and SPXW trade data at one-minute intervals. Its sample runs from July 2020 through June 2023.
The paper examines the possibility of volatility increases under some conditions. It also discusses prior research finding lower average volatility on days when 0DTE options were available.
Those are different questions: an average relationship does not rule out a different effect under particular conditions. Nor does a sample-level result supply a reliable direction or volatility forecast for an individual session.
The practical limit is straightforward: 0DTE activity alone does not establish whether today will be quiet, volatile, trending, or range-bound. Independent research leaves room for different effects; it does not validate GEX as a standalone predictive signal.
What can SPX 0DTE GEX not tell you?
A GEX display cannot independently confirm dealer inventory, establish market direction, or guarantee a reaction at a strike. Its interpretation depends on scope and model assumptions. Use it alongside price action and a risk plan, and prepare for price to move through a prominent level.
Keep these limits visible:
- A model is not observed inventory. Displayed exposure is an estimate, not a dealer’s position statement.
- Volume is not net exposure. Large activity totals can include offsetting trades.
- A marked strike is not a target. Price has no obligation to visit or respect it.
- A changing node does not prove causation. Two observations changing together does not establish which caused which.
- A compelling map does not repair a weak setup. You still need independent chart evidence and an invalidation condition.
Before considering a level-based scenario, write down:
- What price behavior would support the interpretation?
- What behavior would contradict it?
- Where does the idea become invalid?
- What loss could occur if price crosses that boundary quickly?
These questions form the foundation for a session-reading routine and a pre-trade risk checklist. If the answers are missing, the map has not supplied them.
Options and 0DTE trading carry substantial risk of loss. Long options can lose their entire premium, and defined-risk structures are not necessarily low-risk. A heatmap does not remove time decay, execution risk, or rapid adverse movement.
Read the OCC’s Characteristics and Risks of Standardized Options before buying or selling options. This article is educational, not financial advice, and does not recommend a trade.
Frequently asked questions
Can I compare raw GEX values from two platforms?
Only after checking their units, expiration coverage, sign conventions, and definitions. Similar-looking labels do not establish that two displays measure the same thing, so a numerical difference alone is not evidence that either is wrong.
Should I save heatmap screenshots for review?
Yes, provided each screenshot records the symbol, expiration scope, and timestamp. Pair it with the contemporaneous chart and your original interpretation so you can separate what you knew then from what became obvious afterward.
What if a prominent node is far from the current index level?
Record its distance rather than assuming price must reach it. Nearby price structure may be more relevant to an immediate session decision; a distant concentration is not, by itself, a reason to construct a trade.
Is a quiet-looking 0DTE heatmap evidence of low risk?
No. A selected profile may show limited concentration without establishing that the market will remain quiet. Options can still lose value rapidly, and the absence of a prominent node does not replace a loss limit or execution plan.
Can I add the largest nodes from separate expirations to identify an overall level?
Not reliably by comparing visual prominence alone. A node’s relative size on one board does not establish its contribution to a combined profile; aggregation requires compatible units, sign conventions, and clearly defined coverage.
Start with the expiration, then read the level
SPX 0DTE gamma exposure answers a narrower question than a broader expiration profile. Verify the expiry and observation time, compare like-for-like observations, and test your interpretation against price action and a clear invalidation point.
Modeled exposure is not confirmed inventory or a forecast. Same-day options carry substantial risk, regardless of how convincing a heatmap looks.
See the live GEX and VEX heatmaps, options flow and charts for SPX, SPY, QQQ and 230+ symbols. Get TrueGEX: one plan, everything included.
TrueGEX content is for educational purposes only and is not financial advice. Options and futures trading involves substantial risk of loss and is not suitable for every investor. Examples are illustrative; past behaviour of any level does not guarantee future results.
- SPX
- 0DTE options
- gamma exposure
- GEX heatmaps
- dealer positioning
The TrueGEX team builds live gamma and vanna heatmaps, options flow and charts for options and futures traders.