What Is GEX in Options? A Plain-English Guide to Dealer Gamma
Learn how gamma exposure relates to dealer hedging, what positive and negative gamma may imply, and how to read GEX heatmap nodes without treating them as predictions.

A large gamma exposure estimate at a strike does not tell you whether price will stop there. To answer “what is GEX in options?”, start with how gamma changes an option’s directional exposure—and why that may change a dealer’s hedge. This guide connects those mechanics to a practical heatmap-reading routine, with clear limits on what the board can establish.
Key takeaways
- Gamma measures changes in delta. GEX aggregates gamma exposure across options, often grouped by strike and expiration.
- Dealer GEX is modeled exposure, not verified inventory. A displayed sign depends on the provider’s positioning assumptions and definitions.
- Long- and short-gamma positions imply different hedge adjustments. Under a delta-hedging assumption, long-gamma hedging can oppose price moves; short-gamma hedging can reinforce them.
- A prominent node is not a forecast. Compare it with price structure and define what would invalidate your interpretation.
- Options and 0DTE trading carry substantial risk of loss. This guide is educational content, not financial advice.
What is GEX in options?
GEX, short for gamma exposure, measures aggregate exposure to changes in options delta as the underlying price moves. Dealer GEX estimates help traders consider possible changes in dealers’ hedging needs, but they do not verify actual dealer holdings or establish what price will do next.
Gamma and GEX are related, but they are not interchangeable:
- Gamma measures how much an option’s delta changes as the underlying price changes.
- GEX combines gamma exposure across contracts. A display may group estimates by strike, expiration, or an entire options chain.
SpotGamma’s definition of GEX describes estimated local gamma at individual strikes. The word estimated matters: calculating a contract’s sensitivity is different from establishing which participants hold its long and short positions.
For gamma exposure explained in one sentence: GEX helps you frame possible changes in hedging demand under stated assumptions—not establish what dealers hold or what price must do.
What is the difference between delta and gamma?
Delta estimates how much an option’s value changes for a one-unit move in its underlying, holding other inputs constant. Gamma measures how that delta changes as the underlying moves, so a hedge that reduces directional exposure now may need adjustment after price changes.
Suppose a hypothetical option has a delta of 0.50. A small, one-point rise in the underlying would imply roughly a 0.50-point increase in the option’s value, with other inputs unchanged.
Now suppose its gamma is 0.02. After that one-point rise, delta might increase from approximately 0.50 to 0.52. These are local approximations, not fixed relationships across every price move.
The Options Industry Council’s explanation of Greeks cautions that Greeks are estimates—not guarantees of exact option-premium changes. Time, implied volatility, and other inputs can change while price moves.
Delta hedging reduces directional exposure
A delta hedge offsets some or all of a position’s sensitivity to the underlying’s price. As Quant Data explains delta hedging and gamma, delta hedging reduces directional risk, while gamma describes delta’s sensitivity to the underlying.
Think of delta as the directional exposure you have now and gamma as how that exposure changes when price moves.
A delta hedge does not remove every risk. Nor does “hedged” mean a position can remain untouched as market conditions change. For terminology alongside the board, refer to TrueGEX’s key-terms guide.
How can dealer hedging affect price movement?
A dealer holding a long-gamma position may adjust a delta hedge against the underlying’s move; one holding a short-gamma position may adjust with it. These directions follow from assumed positions and hedging behavior—not from observing a positive or negative number on a board alone.
A dealer is a market participant that buys and sells financial instruments, often providing liquidity to other traders. Dealers can accumulate options exposure and use the underlying or related instruments to manage directional risk.
The convention below describes the dealer’s own net position: positive means the dealer is long gamma; negative means the dealer is short gamma. A platform’s displayed dealer-GEX sign depends on its inventory assumptions and definitions, so check those before applying this interpretation.
Under that convention, assuming the dealer adjusts a delta hedge:
- Positive dealer gamma: Rising prices can create a need to sell hedge exposure; falling prices can create a need to buy it.
- Negative dealer gamma: Rising prices can create a need to buy hedge exposure; falling prices can create a need to sell it.
The first tendency can oppose a move. The second can reinforce it. Neither establishes the adjustment’s size relative to other market activity, its timing, or whether it actually occurs.
Check whose gamma the sign describes
A long conventional call or put has positive gamma for its holder; the corresponding short position has negative gamma. Contract type alone does not establish which side a dealer holds.
The distinction is explicit in Unusual Whales’ explanation of gamma exposure, which describes GEX as an assumed dollar exposure associated with market makers’ hedging needs per 1% price change.
The practical question is not just “Is GEX positive?” It is: Whose exposure does that sign represent, under what assumptions?
What would positive or negative gamma look like in a hypothetical SPX example?
Imagine SPX at 5,000 and a hypothetical dealer position around the 5,000 strike. If the dealer is long gamma and maintains a delta hedge, a rise could prompt selling hedge exposure; a short-gamma position could prompt buying instead. This illustrates conditional mechanics, not actual holdings or a forecast.
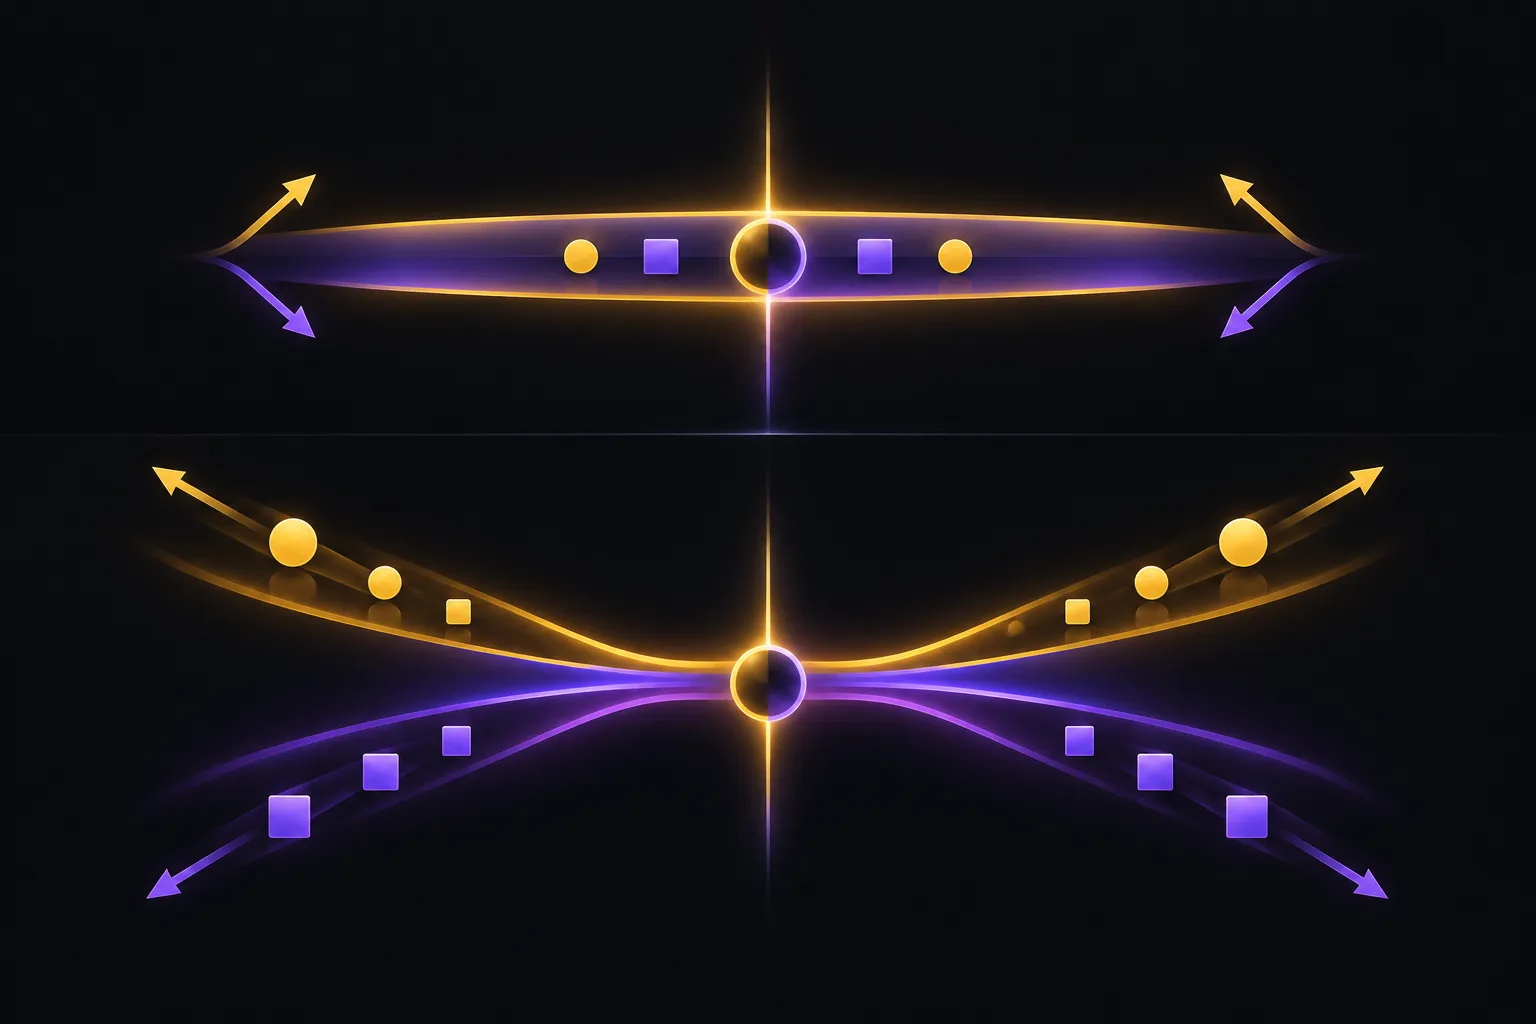 Illustrative long- and short-gamma hedge adjustments around a hypothetical level; actual holdings and future price moves are unknown.
Start with a simplified long-gamma position:
- SPX begins at 5,000. The dealer has an options position and an offsetting directional hedge.
- SPX rises to 5,010. The options position’s delta changes because it has gamma.
- The previous hedge no longer offsets the same exposure. Maintaining the hedge requires an adjustment.
- Under the long-gamma assumption, that adjustment can involve selling exposure into the rise.
If SPX instead falls to 4,990, the corresponding adjustment can involve buying exposure into the decline.
Reverse the assumed position to short gamma, and the hedge tendency reverses too.
| Assumed dealer position | Possible hedge adjustment after SPX rises | Possible hedge adjustment after SPX falls | What this cannot prove |
|---|---|---|---|
| Long gamma | Sell exposure | Buy exposure | That price will stall or reverse |
| Short gamma | Buy exposure | Sell exposure | That price will continue or accelerate |
These are hedge directions, not hedge quantities. Without a specified position size, gamma, hedge instrument, and other assumptions, the example cannot tell you how many shares or futures contracts might be involved.
SPX is an index, so an actual hedge would use related tradable instruments rather than buying the index itself. Other participants’ orders can outweigh the hypothetical adjustments.
This is a mechanics example, not a trade recommendation. No position is proposed, and no risk limit can be inferred from the 5,000 strike.
What does a GEX heatmap show by strike and expiration?
A GEX heatmap organizes estimated exposure across option strikes and, on some boards, expirations. It helps you locate concentrations within a model, but it does not show verified dealer inventory or prove that price will react at a displayed level.
Three terms help you get oriented:
- Strike: The price specified in an option contract.
- Expiration: When the option contract expires.
- Node: A displayed exposure value at a strike and expiration, depending on the board’s layout.
A node at the 5,000 strike expiring today is not interchangeable with one at the same strike expiring next month. They represent different contracts and can change differently as price, time, and volatility change.
Near expiration does not automatically mean dominant exposure
Under some conditions, near-the-money options approaching expiration can have high gamma, meaning delta changes sharply for small underlying-price changes. This is a conditional tendency: gamma depends on strike relative to price, time, implied volatility, and other inputs.
It does not follow that the nearest expiration always dominates aggregate exposure. Contract quantities, ownership assumptions, and offsetting positions also matter. High gamma in an individual contract and large net dealer gamma across a market are different claims.
Volume is not net exposure
A busy options tape does not automatically mean dealers have large net gamma exposure.
In its analysis of SPX 0DTE options and market impact, Cboe distinguishes volume from risk and emphasizes the balance between buying and selling. Substantial activity can include positions that offset rather than accumulate.
Similarly, open interest—the number of outstanding contracts—does not establish which side belongs to a dealer. A contract count is not proof of the inventory assumption behind a dealer-exposure estimate.
Gamma is also only one sensitivity. Vanna describes how delta changes as implied volatility changes, a separate influence from the price-driven adjustments covered here.
How do you read a GEX heatmap without treating it as a forecast?
Start with a prominent node, check how it is changing, and compare its location with nearby price structure. Then observe the actual response. The board can help you ask a better question about a price zone; it cannot answer that question before the market gets there.
Here is a three-step workflow using TrueGEX.
1. Locate the King—but do not confuse size with certainty
The King is the single largest node on a TrueGEX board, highlighted and starred.
Use it as an orientation point. Note its strike, expiration, and distance from current price. Being the largest node does not make it the most predictive level or guarantee that price will visit it.
A prominent node far from the current market may be less relevant to your immediate observation than a smaller node near an active range boundary. Start with prominence, then check location.
2. Check whether the node is growing or fading
Node velocity shows how quickly a node grows or fades across seven windows, from one minute to one day.
This helps separate a prominent estimate that is expanding from one that is shrinking. It does not establish why the change occurred or confirm a directional trade.
The boards update about once a second during the trading session. That cadence helps you monitor changes; it does not remove modeling uncertainty.
3. Compare the zone with adjacent price structure
Now look at your chart. Is the node near an earlier consolidation, a prior session high or low, or the edge of a trading range?
Suppose a prominent node sits near an area where price previously stalled. That overlap gives you a zone to observe—not two guarantees that a reversal is coming.
Watch whether price:
- Slows and trades back into the prior range.
- Pauses briefly, then continues.
- Moves through without a meaningful response.
Use the heatmap guide for board orientation. If you use positioning overlays, the charts documentation explains that workspace. Those chart prices are implied from options and can differ slightly from official prices, so confirm execution prices with your trading platform.
Does a large GEX node mean price will stop or reverse there?
No. A large GEX node is a prominent modeled exposure estimate, not a guaranteed target or automatic support or resistance. Price may react, pass through, or ignore the area, so its usefulness depends on surrounding market conditions and the behavior you actually observe.
Separate these two statements:
Observation: The model displays a large node near 5,000.
Hypothesis: Price might stall near 5,000 if the assumed positioning creates meaningful opposing hedge activity.
The first describes the board. The second adds assumptions about inventory, hedge behavior, timing, and the strength of competing orders.
Calling the level a certain “magnet” or reversal point skips those assumptions. It also makes it easier to rationalize a failed idea: “The node is still there, so price has to come back.”
It does not have to come back. A persistent estimate is not evidence that the market owes you a particular outcome.
What should you check before comparing GEX readings?
Read each platform’s definitions, units, contract coverage, and timestamp before comparing values. Two readings may describe different measurements or positioning assumptions, so a numerical difference alone does not establish that either is wrong—or that one supports a stronger trading conclusion.
Use this checklist:
| Comparison question | What to verify |
|---|---|
| What contracts are included? | The underlying, contract set, and expirations represented |
| What does the number measure? | A local strike estimate or a broader aggregate |
| What are the units? | The stated sensitivity, scaling, and price-change convention |
| Whose exposure does the sign describe? | The positioning convention and inventory assumptions |
| When was it measured? | The timestamp attached to each reading |
This checklist does not assert how any particular platform calculates GEX. It identifies what to establish from its documentation before interpreting a difference.
The underlying measurement gap remains: public contract data alone cannot verify every participant’s inventory. A more frequently refreshed estimate is still an estimate.
Does independent research establish GEX’s standalone predictive power?
Independent research does not establish that a retail GEX heatmap can reliably predict an individual intraday reversal. Findings about future stock returns or aggregate hedging impact address different questions, and they give you reason to question—not assume—the standalone predictive power of a displayed node.
A 2023 empirical finance paper on option gamma and stock returns reports that net gamma exposure negatively predicts future equity returns in its cross-sectional study. Stocks with higher net gamma exposure underperformed those with lower exposure under that study’s method.
That is not the same question as, “Will SPX reverse at this strike over the next ten minutes?”
Cboe’s 0DTE analysis examines another question: estimated net exposure relative to market liquidity. Its distinction between gross volume and net risk challenges the assumption that heavy options activity necessarily creates dominant hedge pressure.
Neither finding establishes a blanket rule for interpreting every intraday node. Apply four checks to any research claim:
- What was measured? A stock portfolio, an index, or a local strike?
- Over what horizon? Future returns are not necessarily an intraday reaction.
- What assumptions were required? Estimated inventory is not observed inventory.
- Does the finding match your intended use? If not, do not treat it as validation.
How do you test—and invalidate—a level-reaction scenario?
Treat a level-reaction idea as a hypothesis with an observable failure condition. Identify the zone and expected response before price arrives; if price moves through and continues trading beyond it without that response, the original scenario fails rather than becoming indefinitely “delayed.”
Consider this hypothetical observation exercise, not a recommended trade:
- Record the context. SPX is below a modeled node near 5,000, overlapping earlier congestion.
- Define the hypothesis. The first approach might stall near that area and return toward the prior range.
- Define failure. Price moves through the zone and continues trading above it without the expected rejection.
- Observe the sequence. Compare price behavior with changes in the estimate rather than focusing on the node alone.
- Record the result. Did the expected response happen, fail, or remain ambiguous?
“Continues trading above” should mean something specific in your observation method. For example, you might require a completed candle beyond a predefined zone followed by a failed attempt to return inside it. That is an illustrative rule, not a universally valid threshold.
A failed rejection idea does not guarantee upward continuation. It only means the original explanation no longer fits.
If an observation informs an actual trading decision, use a separate risk plan with a predefined loss limit or stop condition. A heatmap cannot replace risk controls, and fast moves or gaps can make exits worse than expected.
Frequently asked questions
Is there a universal GEX number that counts as “high”?
No single threshold works across all displays. Before calling a value high, establish its units, contract coverage, aggregation, and sign convention. A raw number without those definitions is difficult to interpret.
Does negative gamma mean dealers are bearish?
No. Negative gamma describes how a position’s delta changes, not a directional opinion. Under a short-gamma delta-hedging assumption, adjustments can follow either rising or falling prices.
What does 0DTE mean?
0DTE means zero days to expiration: the option expires that trading day. Short maturity alone does not establish dealers’ net exposure or a likely market direction. Options and 0DTE trading carry substantial risk of loss.
Can futures traders use options-derived GEX levels?
Futures traders can compare options-derived zones with their existing chart structure. An SPX strike is not automatically the same numerical level as an ES futures price. Account for the instruments’ price difference rather than copying levels blindly.
Should you monitor every node on the board?
No. Start with a small set of relevant zones near current price and record why each matters. Tracking every node encourages explanations after the move; a short watchlist makes your original expectations easier to evaluate.
Put gamma exposure in context
Understanding GEX in options means separating three things: contract sensitivity, assumed dealer positioning, and observed price behavior. The first explains the mechanics, the second frames possible hedging pressure, and the third tests your interpretation.
Use positioning alongside price action—not as a standalone signal—and define invalidation before a level is tested. This is educational content, not financial advice.
See the live GEX and VEX heatmaps, options flow and charts for SPX, SPY, QQQ and 230+ symbols. Get TrueGEX: one plan, everything included.
TrueGEX content is for educational purposes only and is not financial advice. Options and futures trading involves substantial risk of loss and is not suitable for every investor. Examples are illustrative; past behaviour of any level does not guarantee future results.
- GEX
- Dealer gamma
- Options education
- GEX heatmaps
- Options risk
The TrueGEX team builds live gamma and vanna heatmaps, options flow and charts for options and futures traders.