What Is Vanna Exposure in Options? A Plain-English Definition
Vanna measures how an option’s delta responds to implied-volatility changes, while VEX aggregates that sensitivity across modeled positions. Learn how it differs from gamma and why a VEX reading is context, not a price forecast.

What is vanna exposure in options, and why can delta change when price barely moves? Vanna measures how an option’s delta changes when implied volatility changes; vanna exposure, or VEX, aggregates that sensitivity across modeled positions. Understanding it helps you interpret volatility-related positioning without assuming that falling volatility automatically means rising prices.
This primer separates vanna from gamma and vega, uses a constant-price example, and explains how to read a VEX heatmap without turning it into a directional forecast.
Key takeaways
- Vanna measures delta’s sensitivity to implied volatility; vega measures an option’s value sensitivity to implied volatility.
- Gamma connects underlying-price changes to delta changes. Vanna connects implied-volatility changes to delta changes.
- VEX is a model-dependent aggregate estimate, not a complete view of dealer inventory.
- A volatility move alone does not establish a hedge response, price target, or market direction.
- Use positioning alongside price action and a risk plan. Options, including 0DTE options, carry substantial risk of loss.
What is vanna exposure in options?
Vanna exposure, or VEX, is a modeled aggregate of delta’s sensitivity to changes in implied volatility. An individual option has vanna; an aggregate VEX reading combines sensitivities across the positions, strikes, or expirations represented. Its interpretation therefore depends on the positions modeled and the display’s conventions.
The Options Industry Council’s vanna definition describes delta’s rate of change with respect to implied volatility and classifies vanna as a second-order Greek.
There are two layers:
- Option-level vanna: How one option’s delta responds to a change in implied volatility.
- Aggregate VEX: How those sensitivities combine across a modeled set of exposures.
“Second-order” means vanna measures a change in another Greek—here, delta—rather than directly measuring a change in the option’s value.
A small glossary: delta, implied volatility, vega, and hedging
These four terms provide the foundation for understanding vanna exposure:
| Term | Plain-English meaning |
|---|---|
| Delta | A theoretical estimate of how much an option’s value changes for a $1 change in the underlying, holding other inputs constant. |
| Implied volatility, or IV | The volatility input implied by market option prices—not a promise of future realized movement. |
| Vega | An option’s value sensitivity to a change in IV. |
| Hedging | Taking an offsetting position to manage an exposure. |
For hedging, the relevant exposure is the net position, not necessarily one option viewed alone.
Greeks are estimates, not instructions for how premiums must behave. The OIC’s guide to understanding options Greeks identifies price, time to expiration, and IV as pricing inputs and describes Greeks as theoretical guideposts—not guarantees of exact premium changes.
How can implied volatility change delta when price stays still?
Delta can change when IV changes even if the underlying price stays fixed. Vanna describes that sensitivity, but any resulting hedge adjustment depends on the sign and size of the positions involved, their combined exposures, and the hedging decisions made—not simply whether volatility rose or fell.
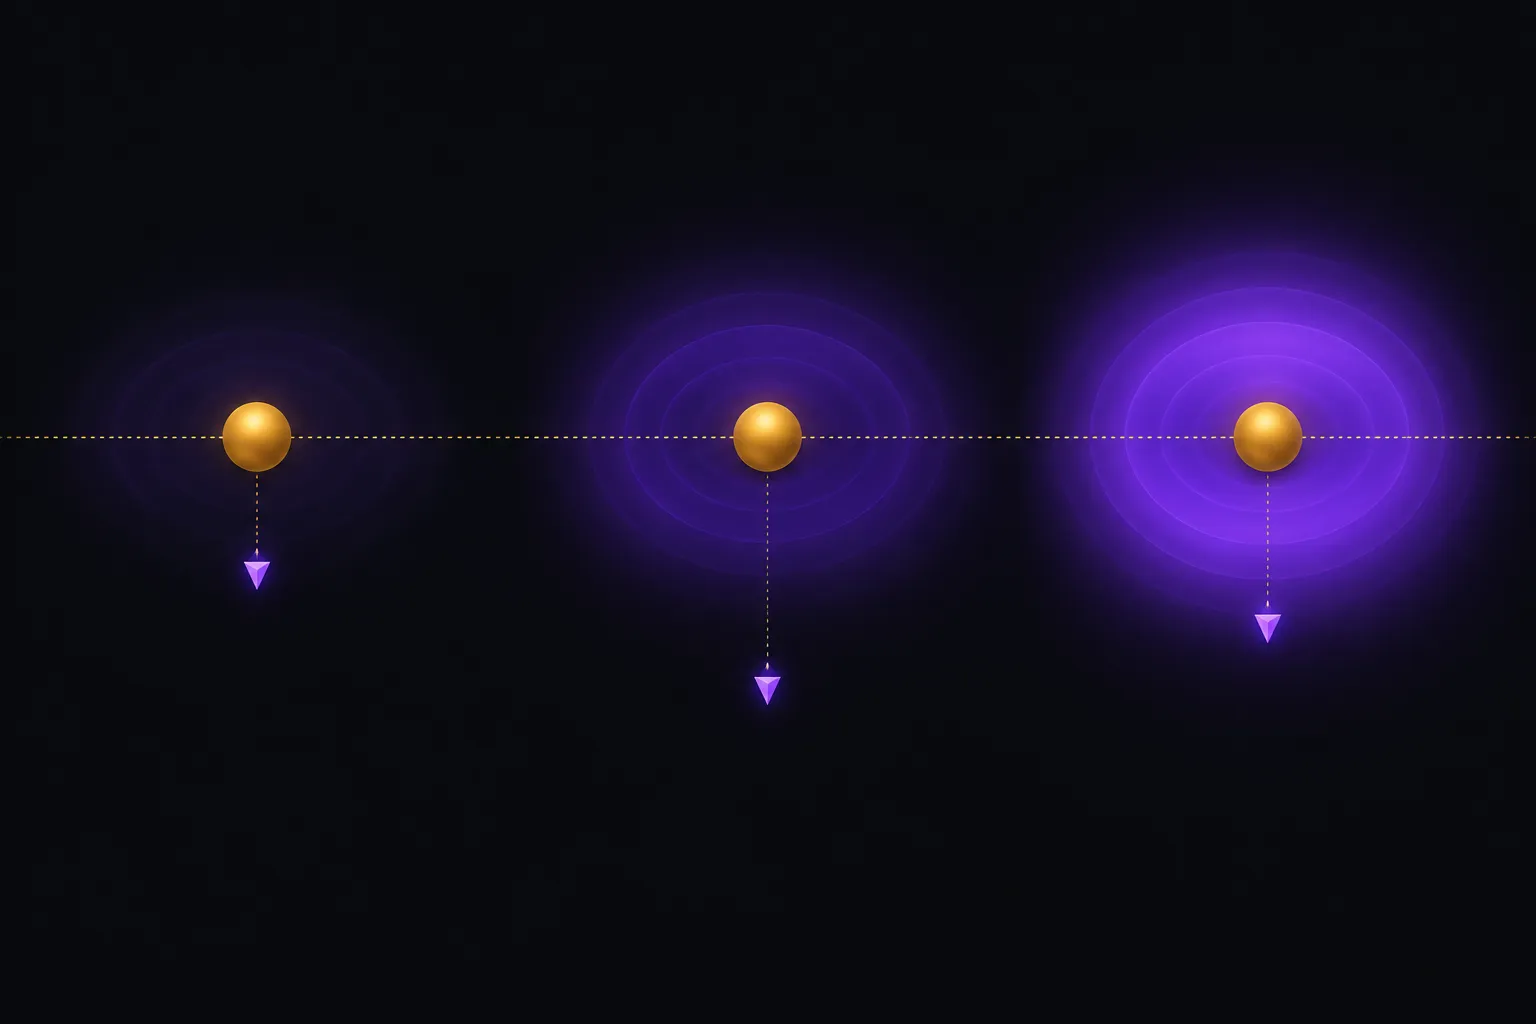 Vanna describes how delta changes when implied volatility changes, even with the underlying price held fixed.
Consider this hypothetical sensitivity exercise, not a trade recommendation. Keep the same option contract and hold all other relevant pricing inputs constant so that only IV changes.
| Input | Starting point | Comparison point |
|---|---|---|
| Underlying price | $100 | $100 |
| Time to expiration | Held constant | Held constant |
| All other relevant pricing inputs | Held constant | Held constant |
| Implied volatility | 20% | 25% |
| Option delta | Initial estimate | Recalculated estimate |
The move from 20% to 25% is five percentage points, not a 5% relative increase. For comparison, a one-percentage-point increase takes IV from 20% to 21%; a 1% relative increase takes it from 20% to 20.2%.
The table deliberately leaves delta unspecified: the inputs shown are insufficient to calculate it.
For an option with nonzero vanna, delta responds to IV changes. But long and short positions in the same contract have opposite exposures. Other positions can offset or reinforce that sensitivity.
The OIC’s explanation of net Greeks and market-maker exposure emphasizes that combined exposure governs a spread’s behavior and that market makers carry positions across multiple strikes, expirations, and underlyings.
Reverse the hypothetical IV move—from 25% to 20%—and the same caution applies. “IV down means market up” is not a rule you can derive from vanna alone.
What is the difference between gamma and vanna?
Gamma measures how delta changes as the underlying price changes. Vanna measures how delta changes as implied volatility changes; both concern delta, but they isolate different inputs. Vega is different again: it measures how IV changes an option’s theoretical value, rather than its delta.
| Greek | Input that changes | Sensitivity measured |
|---|---|---|
| Gamma | Underlying price | Change in delta |
| Vanna | Implied volatility | Change in delta |
| Vega | Implied volatility | Change in option value |
For a controlled comparison, hold the other inputs constant. During a live session, price, IV, and time can change together, making their effects harder to separate.
For the broader dealer-hedging foundation, read What Is GEX in Options? A Plain-English Guide to Dealer Gamma. The distinction here is the source of the delta change: price for gamma, IV for vanna.
What does aggregate VEX tell you—and what can’t it tell you?
Aggregate VEX provides modeled context about how delta exposure may respond to IV changes across the positions represented. It cannot independently establish a price target, trade direction, or complete view of dealer inventory, and its sign should not be translated automatically into “bullish” or “bearish.”
Before interpreting a reading, separate three questions:
- Coverage: Which strikes and expirations does it represent?
- Convention: What do its sign and units mean?
- Context: Where does exposure sit relative to price, and what is price actually doing?
Do not assume two displays use interchangeable definitions or scales. Check the documentation before comparing their numbers.
A modeled positioning reading is not, by itself, a validated forecast. Research on related gamma measures examines predictive relationships for a particular sample and measure; it does not establish the predictive power of a vendor’s VEX display.
How can you inspect VEX on a heatmap?
Use a VEX heatmap to locate modeled exposure across strikes and expirations, then compare it with GEX and observed price action. Ask whether positioning adds context to your existing setup—not whether a highlighted strike must attract price or hold as support.
TrueGEX displays GEX and VEX heatmaps at every strike and expiration, with boards updating about once a second during the trading session. Follow the TrueGEX heatmap guide and use this sequence:
- Choose your symbol and expiration. Identify which part of the options chain you are examining.
- Inspect nearby GEX and VEX concentrations. Do not assume the largest exposure must control the session.
- Compare exposure changes with price response. Observe whether price pauses, rejects, or moves through an area.
- Write your invalidation. Define what price behavior would contradict your setup, along with a stop and maximum acceptable loss.
If price moves through an area your thesis required to hold, the heatmap does not justify ignoring that failure. Neither GEX nor VEX replaces risk management.
This article is educational, not financial advice. Options and 0DTE trading carry substantial risk of loss.
Frequently asked questions
Does a constant-price example describe a real trading session?
It isolates one sensitivity rather than reproducing an entire session. In live trading, price, IV, and time can change together, so an observed delta change cannot automatically be attributed entirely to vanna.
Can every option’s vanna be treated as a fixed number?
No. Vanna describes sensitivity at a given set of inputs, not a permanent property with an unchanging value. Be cautious about extending one reading across a large IV change.
What is the SpotGamma Vanna Model?
At the time of writing, SpotGamma describes its Vanna Model as shifting IV along with the underlying price, with a comparison line that holds IV unchanged. That differs from this article’s constant-price exercise: one explores a combined scenario, while the other isolates IV sensitivity.
Does VEX tell me whether an option premium will rise?
Not by itself: vanna concerns delta’s response to IV, not the premium’s direct response. Vega describes the latter sensitivity, while price changes and time also affect option value.
Put vanna exposure in context
The answer to “what is vanna exposure in options?” starts with delta’s sensitivity to IV. VEX aggregates that sensitivity into modeled context—not a price target, complete inventory report, or standalone signal.
See the live GEX and VEX heatmaps, options flow and charts for SPX, SPY, QQQ and 230+ symbols. Get TrueGEX: one plan, everything included.
TrueGEX content is for educational purposes only and is not financial advice. Options and futures trading involves substantial risk of loss and is not suitable for every investor. Examples are illustrative; past behaviour of any level does not guarantee future results.
- vanna exposure
- VEX
- implied volatility
- options Greeks
- dealer positioning
The TrueGEX team builds live gamma and vanna heatmaps, options flow and charts for options and futures traders.